You open two tabs for the same peptide. One vendor lists a vial at a lower price. Another looks more expensive, but the label format is different, the concentration isn’t presented the same way, and shipping only appears at checkout. Then the lab report is either buried, outdated, or impossible to read.
That’s where most peptide price comparison goes off the rails.
The wrong way to compare peptides is to ask, “Which vial is cheapest?” The right question is, “What is my true all-in cost per usable dose once I account for amount, purity, reconstitution, shipping, and waste?” If you don’t calculate that number, you’re not comparing value. You’re comparing packaging.
That matters more now because peptides are no longer a tiny corner of the market. The peptide therapeutics market was valued at USD 140.86 billion in 2025 and is projected to reach USD 294.58 billion by 2033, with a projected 8.73% CAGR from 2026 to 2033. North America held 61.99% of the market in 2025, which gives that region outsized influence on pricing norms and supplier behavior, according to Grand View Research’s peptide therapeutics market analysis.
Use that scale as context. More suppliers, more listings, and more pricing formats create more noise, not more clarity.
A cleaner process helps. Start with a simple side-by-side.
| Comparison Factor | Cheap-Looking Listing | Better Listing |
|---|---|---|
| Headline vial price | Lower | Higher |
| Total peptide disclosed | Unclear or buried | Clear |
| Purity documentation | Missing or weak | Recent and readable |
| Reconstitution assumptions | Not stated | Easy to calculate |
| Shipping impact | Hidden until checkout | Visible early |
| Real value signal | Poor | Stronger |
Table of Contents
- The Real Challenge of Peptide Price Comparison
- Why Sticker Price Is a Misleading Metric
- How to Calculate Your True Cost Per Dose
- Evaluating Vendor Quality and Purity Reports
- Factoring in Shipping Taxes and Bulk Discounts
- A Reproducible Checklist for Smart Peptide Purchases
The Real Challenge of Peptide Price Comparison
The hard part isn’t finding a peptide listing. The hard part is deciding whether two listings are even comparable.
A BPC-157 vial priced lower on one site can still be a worse buy if the amount is smaller, the purity is weaker, the shipping is padded, or the product arrives with poor documentation. Buyers get trapped because vendors rarely present all of those variables in one place. They highlight the sticker price because it wins attention fast.

What makes the comparison difficult
Several variables distort the picture at the same time:
- Different label formats mean one seller emphasizes vial price while another emphasizes amount or concentration.
- Incomplete specs force you to guess what’s in the vial.
- Purity differences change how much usable material you’re really buying.
- Checkout add-ons shift the final cost after you’ve already made the mental decision to buy.
That’s why peptide price comparison needs a repeatable framework, not intuition.
Practical rule: If you can’t identify the total peptide amount, the quality documentation, and the final delivered price, you can’t rank the offer.
Why this skill matters now
The category has grown large enough that sloppy comparison gets expensive. Broad peptide demand didn’t stay niche. Therapeutic peptide drug sales were about USD 20 billion in 2017 and were expected to surpass USD 50 billion by 2024, a more than 150% increase, and by 2020 there were over 70 therapeutic peptide products approved as new chemical entities in the United States, Europe, and Japan, with more than 100 commercial products available globally, as described in this peer-reviewed overview of peptide therapeutics.
More products create more opportunities to compare. They also create more ways to compare badly.
The useful metric isn’t “price per vial.” It’s true cost per usable dose. Once you start using that lens, weak listings become obvious. So do the vendors that deserve your attention.
Why Sticker Price Is a Misleading Metric
You open two tabs. One vendor shows a 5 mg vial for a low price. Another shows a 10 mg vial that looks expensive at first glance. Buyers who stop at the product page often pick the first tab and pay more per usable dose.
That mistake happens because sticker price is presentation, not analysis. Vendors choose what to emphasize. One page highlights the lowest item price. Another highlights concentration. Another buries vial size until checkout. If you do not normalize the offer, you are comparing layout and copy, not value.
Cost per milligram is the first screen
Start with cost per milligram. It is not enough to make a purchase decision, but it quickly removes bad offers.
Use a simple check:
cost per mg = vial price ÷ total mg in the vial
A $40 vial with 5 mg costs $8 per mg. A $65 vial with 10 mg costs $6.50 per mg. The second vial looks pricier and is cheaper on substance alone.
At this stage, many buyers stop. I do not. Cost per mg is only a screening layer.
Why cost per milligram still falls short
Two vials can match on cost per mg and still have very different all-in value.
The usual gaps are practical:
- Purity and documentation affect how much confidence you should place in the stated amount
- Reconstitution choices affect how easy it is to measure your intended dose accurately
- Shipping and checkout fees can wipe out a price advantage on smaller orders
- Bundle discounts can lower unit cost while pushing you into buying more than you can reasonably use
- Vial format can create waste if your protocol uses small doses and the product does not fit your dosing plan
Reconstitution is a good example. A vial may be cheap on paper, but if the concentration after mixing makes your target dose awkward to draw, day-to-day use gets sloppy. That is one reason I keep a peptide reconstitution calculator for dose planning in the workflow before I decide whether a listing is a bargain.
Cheap per vial and cheap per dose are not the same thing.
The same pricing logic shows up in other technical purchases. If you have seen Cryonos’s comprehensive cost breakdown, the lesson is familiar. The advertised number is only one line item. Handling, storage, and delivery change the purchase decision. Peptides follow the same pattern.
What to compare instead
Use a three-part filter before you call any listing a deal:
- Total peptide amount
- Normalized price per mg
- Expected delivered cost and practical usability
That third step is where weak offers fall apart. A low headline price can still lose once you include shipping, fees, realistic yield, and whether the vial format fits your dosing plan.
Good peptide price comparison starts after the sticker price, not before.
How to Calculate Your True Cost Per Dose
This is the math that clears the fog. Once you run it a few times, peptide price comparison becomes mechanical instead of emotional.

Start with the only numbers that matter
You need five inputs:
-
Vial price
The listed item price before or after discounts, depending on what you’re testing. -
Total peptide in the vial
Usually shown in mg. -
Desired dose size
Often thought about in mcg, so convert carefully. -
Shipping and checkout costs
Add these to get landed cost. -
Expected usable yield
Expected usable yield accounts for handling loss, leftover solution, or anything that reduces what you can realistically use.
The key conversion is simple: 1 mg = 1000 mcg.
If your target dose is written in micrograms and the vial is written in milligrams, convert before doing anything else. Most bad math starts there.
Use a simple cost-per-dose formula
Use this sequence:
- Convert vial amount to the same unit as your dose
- Divide total vial amount by your dose size
- That gives doses per vial
- Add shipping and any unavoidable fees to the vial price
- Divide total landed cost by doses per vial
Written plainly:
True cost per dose = landed cost ÷ usable doses per vial
If you also want a protocol-level view, multiply that result by however many doses you plan to take across a week or cycle.
A calculator helps if you’re adjusting concentration after reconstitution. For that part, this peptide reconstitution calculator guide is useful because it focuses on turning raw vial numbers into practical dosing math.
After you understand the formula, it helps to watch someone work through the setup visually.
Worked comparison you can copy
Use a simple example with no hidden assumptions.
Vendor A
- Vial price: qualitatively lower
- Total peptide: 5 mg
Vendor B
- Vial price: higher
- Total peptide: 10 mg
Assume your planned dose is the same for both vendors.
Now run the process:
- Convert each vial amount to the same unit as your dose.
- Calculate how many doses each vial contains.
- Add shipping and any fees.
- Divide total delivered cost by usable doses.
If Vendor A looks cheaper upfront but contains half the peptide, Vendor B may end up cheaper per dose before you even factor in discounts or shipping. That’s the exact trap headline pricing creates.
If two sellers use different presentation styles, reduce both offers to one unit. Cost per usable dose. Everything else is noise.
A fill-in template for vendor comparisons
Use a sheet like this every time. Don’t rely on memory.
| Metric | Vendor A | Vendor B |
|---|---|---|
| Vial price | ||
| Total peptide in vial | ||
| Dose size | ||
| Doses per vial | ||
| Shipping and fees | ||
| Estimated usable yield adjustment | ||
| Total landed cost | ||
| True cost per dose |
Where reconstitution fits
Reconstitution doesn’t change how much peptide is in the vial. It changes how easy it is to measure each dose accurately.
That distinction matters. A concentration that’s awkward to draw consistently can increase practical dosing error. A concentration that’s easy to work with usually makes your routine cleaner and reduces avoidable waste. For most buyers, that’s part of the true cost even if it never appears on the invoice.
If you want a durable system, separate your work into two calculations:
- Value math for price and dose count
- Preparation math for concentration and draw volume
When those two agree, your comparison is solid.
Evaluating Vendor Quality and Purity Reports
Price only matters if the material is what the label says it is.
A vendor can look competitive right up until you open the COA and realize the report is stale, incomplete, mismatched to the product page, or too vague to verify anything. That’s why quality review sits next to pricing, not after it.

What to check on a COA
A useful COA should let you verify basic identity and quality without guesswork.
Look for:
- Correct compound name that matches the listing exactly
- Recent test date rather than an old recycled document
- Batch or lot reference that connects the report to the actual product
- Purity result shown clearly
- Testing method disclosure such as HPLC or MS when provided
- Readable formatting instead of a blurry image upload
If the vendor posts a report that can’t be tied to the batch, that report has limited value. It may still indicate intent, but it doesn’t give you a clean verification trail.
For a more detailed breakdown of how to inspect these documents, this guide to peptide purity testing is a practical reference.
Purity changes the math
Purity doesn’t just affect scientific neatness. It affects value.
A peer-reviewed industry analysis notes that 5 mg lots at 95% purity can cost about $300 each, while a 20-mer at 98% purity can be around $1,000. The same analysis estimates peptide API costs of $20,000–30,000 for preclinical programs and $250,000–400,000 for early clinical quantities, yet still only about 1–3% of total development cost, according to PharmOutsourcing’s analysis of peptide development costs.
For the buyer, the point is simpler. Purity-adjusted cost beats sticker price.
A lower-purity product can look cheaper while delivering worse usable value. If you’re comparing one vial with stronger documentation and higher purity against a cheaper listing with weak documentation, don’t pretend those are equivalent offers.
Buy the report, then the vial. Not the other way around.
Operational signals that matter
Quality control isn’t only about lab paperwork. The vendor’s operations show up in the customer experience.
Watch for signs like these:
-
Packaging discipline
Labels should be legible and consistent. Sloppy labeling often pairs with sloppy recordkeeping. -
Clear shipping practices
Delivery handling matters, especially when vendors make special claims about storage or stability. If you sell or manage sensitive products online, understanding managing online pharmacy shipping restrictions gives useful context for what responsible logistics communication looks like. -
Responsive support
Ask a direct question about a batch report or product format. Serious vendors answer clearly. Weak vendors stall, dodge, or paste canned replies.
Vendor quality is part of cost. A cheaper order that arrives with ambiguity, delays, or unusable documentation is not a bargain.
Factoring in Shipping Taxes and Bulk Discounts
Two carts can show the same vial count and very different final math. One looks cheaper on the product page, then adds high shipping, tax, a cold-pack fee, and a weak bulk discount that only applies after a minimum spend. The other starts higher and finishes lower.
That is why I track delivered cost first, then cost per dose.
Landed cost beats cart subtotal
A usable comparison sheet needs one line for every charge that hits your card or arrives later at the border:
- Base product cost
- Shipping charge
- Taxes collected at checkout
- Customs or import-related charges when relevant
- Cold-chain or special handling fees
- Payment processing fees or currency conversion costs
This part gets missed because vendor pages are built to sell the vial, not the total order. The fix is simple. Build the comparison from the checkout screen backward, not from the listing page forward.
Cross-border orders need extra caution. A low list price can disappear once import fees show up. If you ship into Canada, how to calculate import duties for Canada is a practical reference for estimating whether the order still makes sense before you pay.
When bulk deals actually help
Bulk discounts only improve value if the larger order lowers your real cost per dose and fits your actual use window.
Use this sequence every time:
- Record the full landed cost at regular pricing
- Apply the bulk discount or coupon
- Recalculate the new delivered total
- Divide by total usable doses
- Check whether your storage and timing still work
That last step matters more than buyers admit. Extra vials are only cheaper if you can store them correctly and use them before quality becomes a question. If you are ordering ahead, review the practical shelf-life issues covered in this guide on how long peptides last in storage.
I also watch the discount structure itself. “Buy more, save more” sounds good, but some vendors use inflated base prices so the sale only brings them back to average. Others offer free shipping above a threshold, which can beat a larger percentage discount from another seller. The only clean way to compare those offers is to calculate the final delivered total, then reduce it to cost per dose.
A disciplined buyer treats bulk pricing as a spreadsheet decision. If the larger order adds waste, storage risk, or import friction, the “deal” was expensive.
A Reproducible Checklist for Smart Peptide Purchases
Two vendors can list the same peptide strength and still deliver very different value by the time the order is on your desk. One looks cheaper on the product page. The other wins once you account for usable doses, shipping, batch documentation, and whether the vial format fits your protocol.
A disciplined buying process removes guesswork. I use the same checklist every time because it forces a clean comparison and keeps me from overpaying for a “deal” that falls apart at checkout or during use.
A significant gap in most online content is that it does not answer the primary buyer question. What is the all-in cost after dilution choices, shipping, and realistic use? That gap is exactly what PeptidePlus highlights in its discussion of true landed cost per usable dose.

Pre-cart checks
Start before the cart. If the listing is vague, the comparison is already weak.
-
Capture the vial amount
Confirm total peptide content per vial. If the listing makes you infer it, move on until the numbers are clear. -
Normalize the offer
Convert each option to the same unit, then calculate cost per milligram. This gives you a clean base before shipping, dilution, and dose count enter the picture. -
Review the COA
Check that the compound name, batch reference, date, and purity presentation line up with the product being sold. A COA that is outdated, generic, or disconnected from the listing lowers confidence fast. -
Check fit with your protocol
A vial can look cheap on paper and still be inefficient if the size, concentration target, or handling steps create friction in your routine.
Cart and checkout checks
A common failing point for weak comparisons emerges. Product-page pricing is only a starting point.
- Record the pre-discount subtotal.
- Add shipping and taxes.
- Apply coupon codes after you log the undiscounted total.
- Recalculate cost per usable dose with your own reconstitution assumptions.
- Compare final delivered cost, not list price.
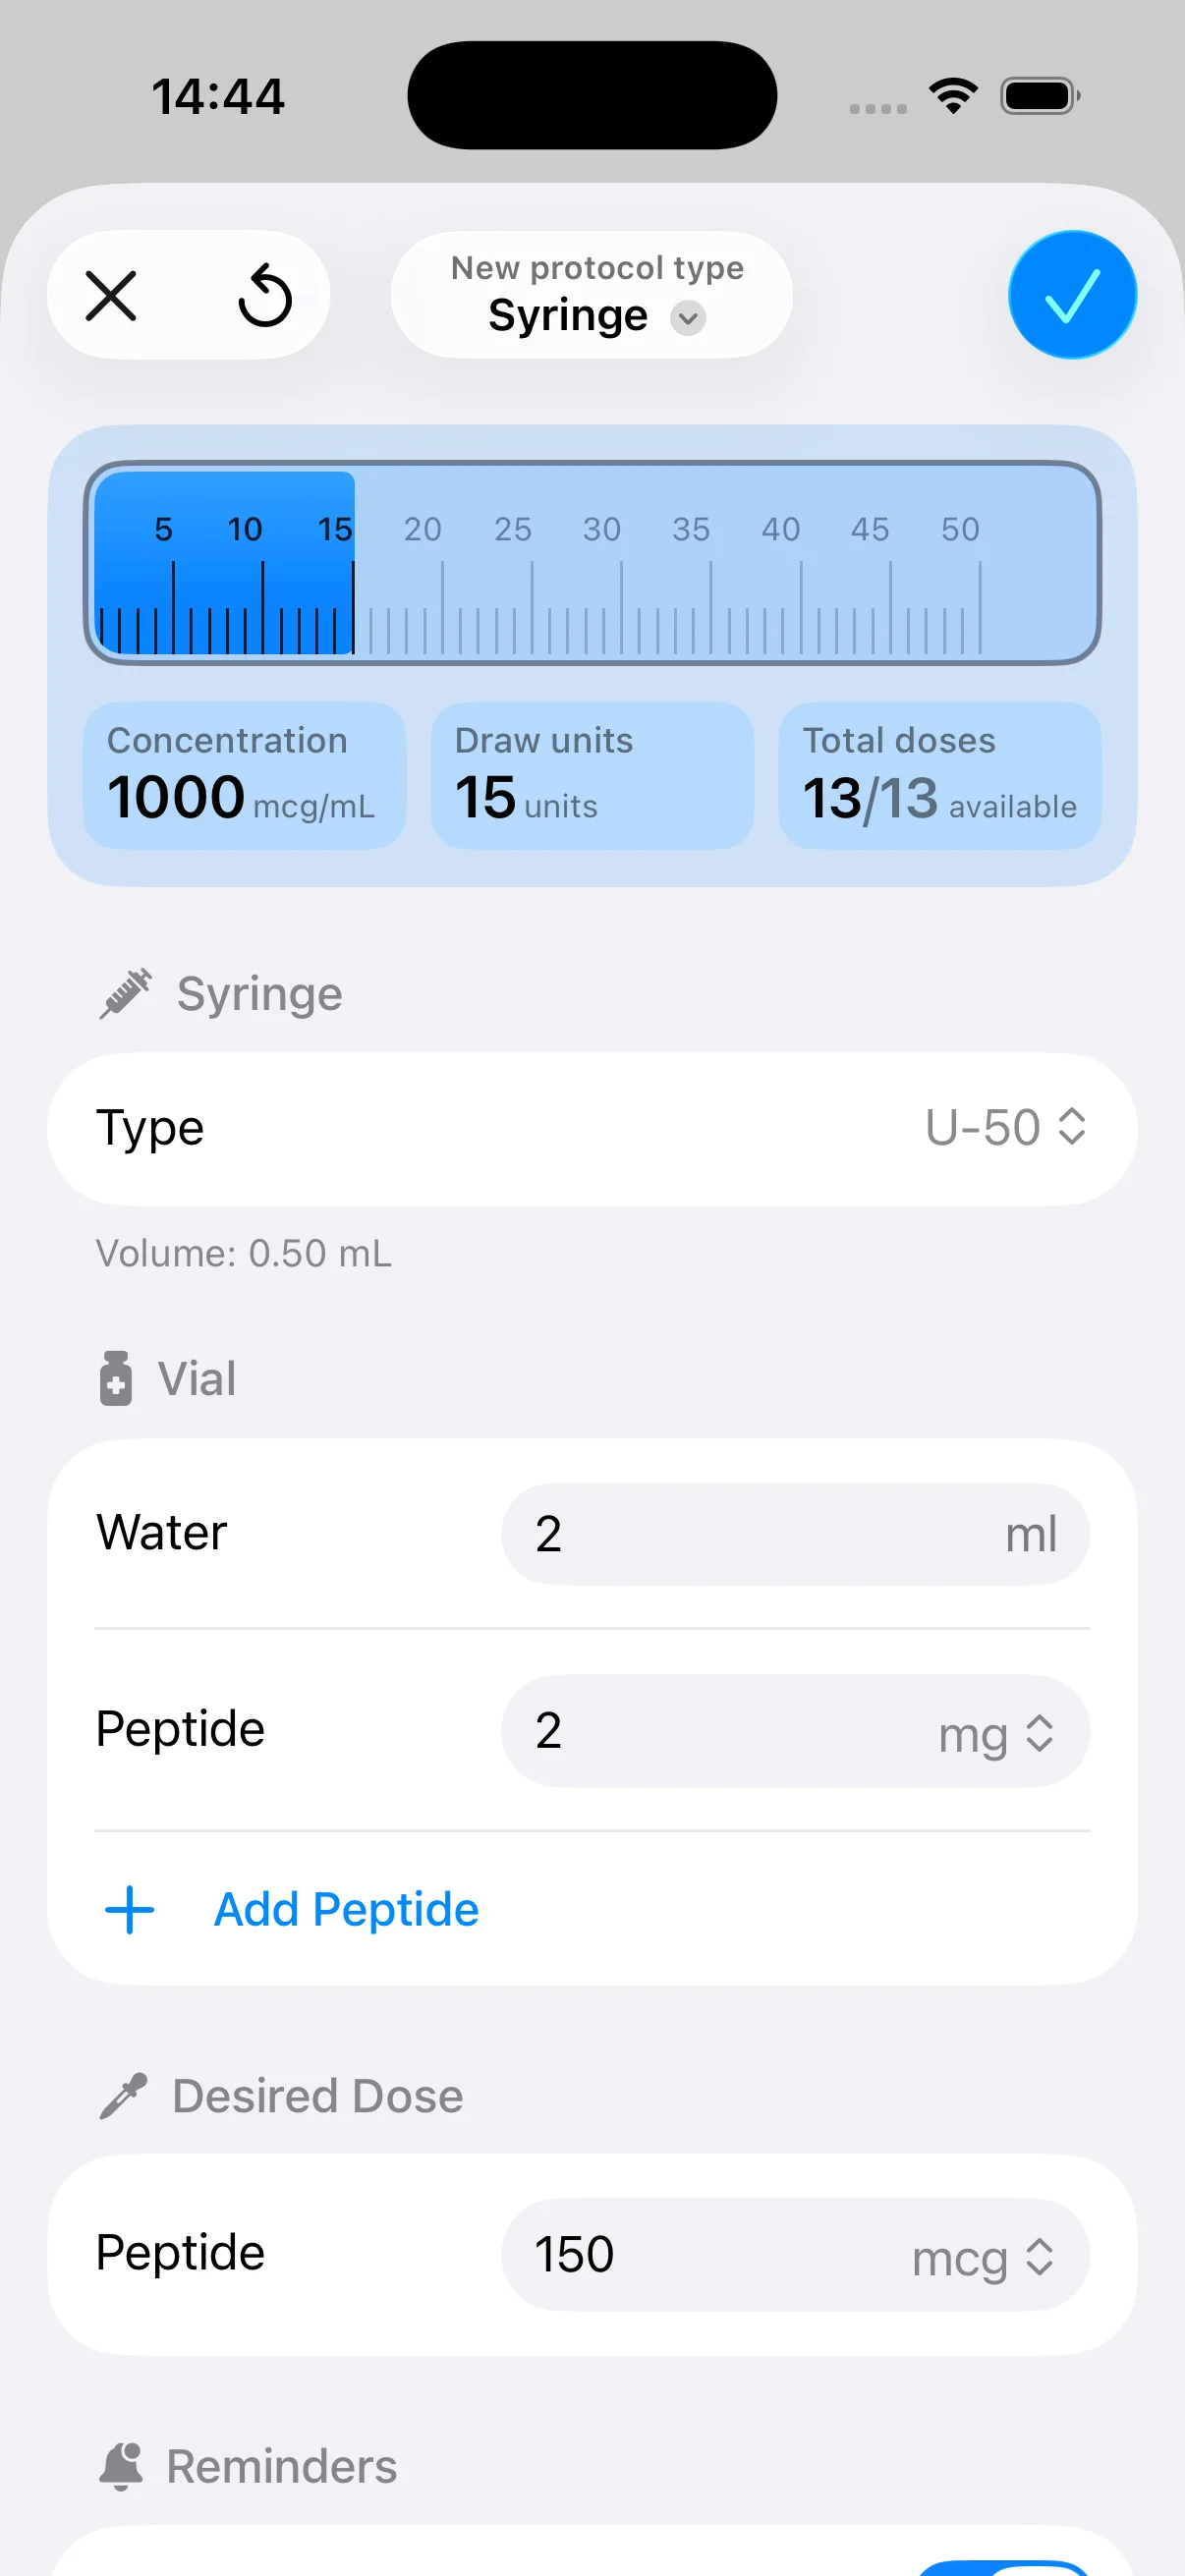
If you use a digital tool for routine planning, keep it grounded in the numbers you will use. For example, PepFlow is an iOS app that handles dosage calculation, scheduling, reminders, and protocol tracking. That helps keep concentration math and the dosing routine aligned instead of scattered across notes, screenshots, and memory.
A clean purchase decision produces two outputs. The lowest acceptable cost per usable dose, and the lowest chance of a handling or dosing error later.
Post-delivery checks
The order is not finished when the package lands.
Run one final pass and log what showed up, not what the listing promised.
- Inspect labeling against the order confirmation and product page
- Save the batch report you used during the buying decision
- Check physical condition of the vial, seal, and packaging
- Document your reconstitution setup so future comparisons use the same assumptions
- Record delivered cost and usable dose count for the next time you compare vendors
This record-keeping step is what separates repeatable buying from impulse buying. Buyers who get better value over time usually do not have secret sources. They have cleaner data and a tighter process.
If you want help turning vial specs into practical dosing numbers and keeping a peptide schedule organized, PepFlow is a simple option for calculating doses, planning protocols, and tracking adherence without doing the same math by hand every time.